Buying from someone I didn't know was a bit of a leap of faith. Would he actually deliver? I've been pleasantly surprised. Andrew has been fair, and sometimes more than fair.
Migrated from HighLevel
Join the Seedly owners community →You are not buying alone. Seedly owners trade setups and share add-ons. Join the community →
A dozen-plus reporting views covering pipeline, revenue, campaigns, calls, and paid ads, with per-client rollups and an agency-wide view. Real data, exportable, and yours to change because you own the code.

One payment. Full source code. Unlimited seats, every client, forever.
Don't take our word for it. Take theirs.
Every review 5 out of 5 on Trustpilot. These are agency owners who made the same $1,499 decision you are weighing, in their own words.
What It Does
The Paid Ads view pulls live Google Ads campaign performance with per-campaign drill-down (ad groups, keywords) and the leads each campaign produced. The Organic (GA4) view pulls real Google Analytics traffic and engagement. When an account is not connected, you get an honest "connect this account" prompt instead of invented numbers.
Ad conversions are attributed at the deal level rather than to whatever touch happened last, and they are dated when the money actually moved, not when the automation happened to run. The real amount goes back to Google Ads and Meta, so the platforms optimize against revenue instead of a bare lead count. Conversions fire from forms embedded on your own site too, and dynamic number insertion is a switch you flip yourself.
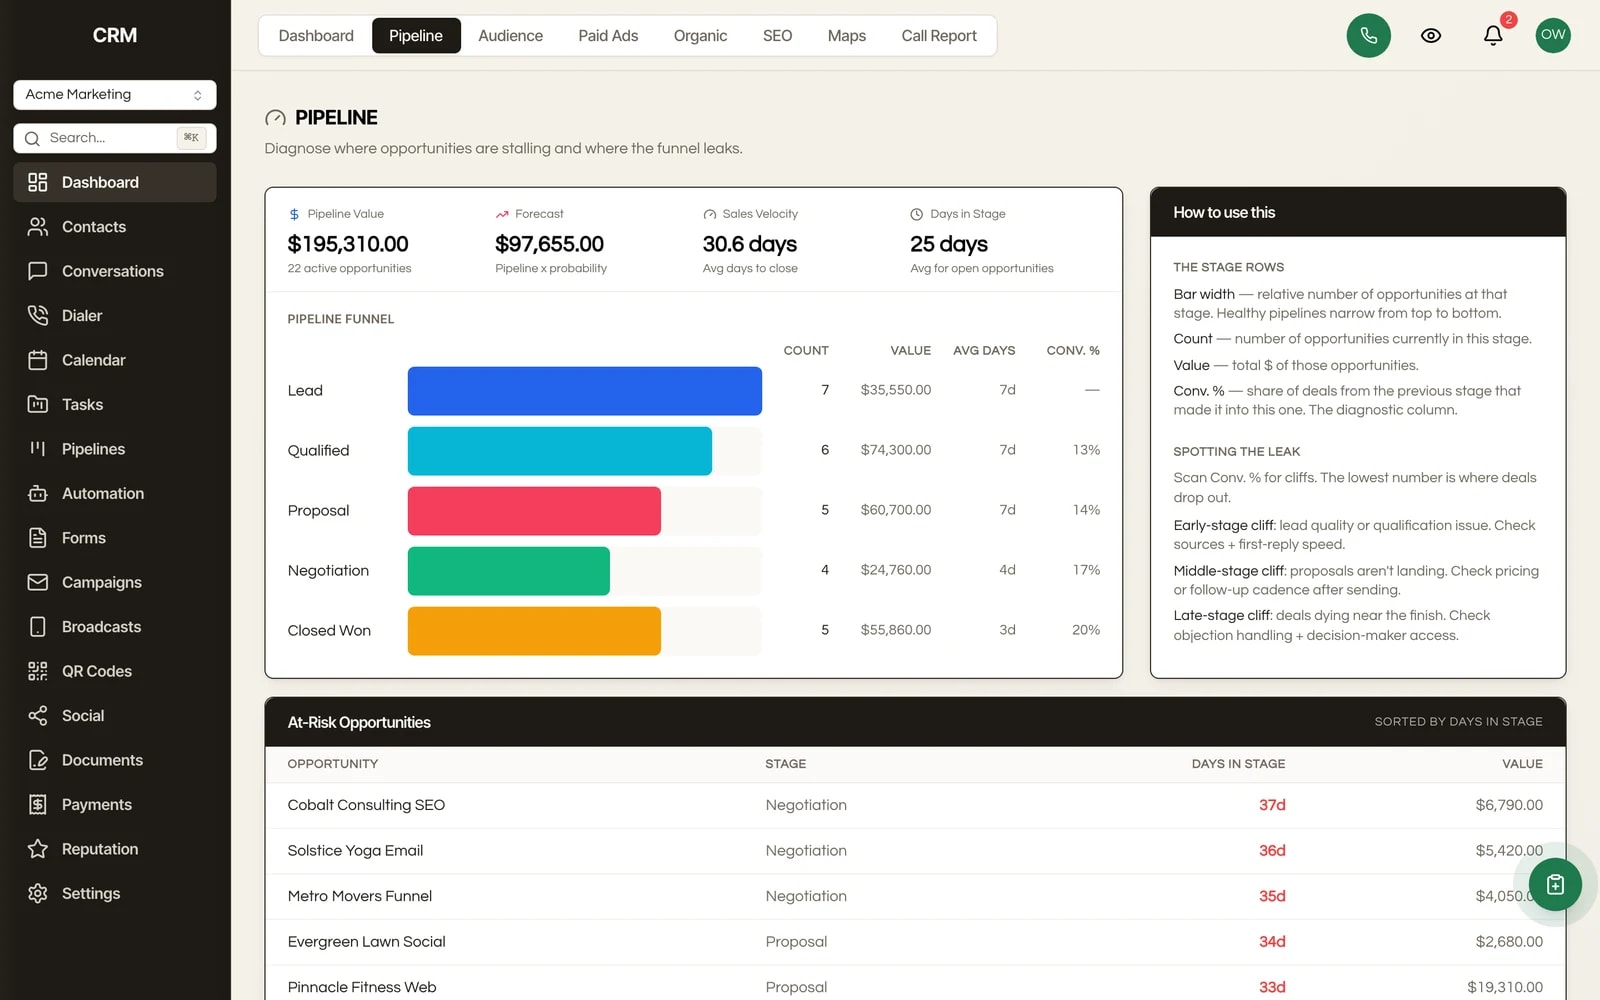
The Pipeline view shows opportunity metrics, win/loss analysis, sales velocity, stage breakdown and a weighted revenue forecast, built from your actual deal records. Pair it with invoice metrics (revenue, outstanding, overdue) for a real money picture, not just lead counts.
KPI cards for total contacts, active opportunities, unread conversations, overdue invoices, open tasks and scheduled appointments, plus an activity timeline of recent CRM events, pipeline value, invoice revenue, and a deal funnel. All wired to your real data.
The SEO view puts Google Business Profile visibility (how often the profile shows in Search and Maps, and the website clicks, calls, and direction requests it drives) next to Google Search Console for the client's website (clicks, impressions, click-through rate, average position, and the queries they rank for). Each half connects on its own and shows a plain connect prompt until it does, so you never put invented numbers in front of a client.
The Call Report shows call KPIs, outcomes and dispositions, a per-rep leaderboard, and click-through detail on any single call, including recording and transcript where available. Most CRMs make you buy a separate dialer-analytics product for this.
Dedicated reports for Conversations (message volume, channel breakdown, response times), Campaigns (email and SMS performance, deliverability, engagement funnel), Workflows (execution stats and success rates), Calendar (appointment metrics), Acquisition and Attribution (where leads and deals actually came from), Lifecycle, and Agent Performance.
Every report is scoped to one client sub-account, so each client sees only their numbers. An agency-wide analytics view rolls all your clients into one screen with per-client performance and health, which is exactly the cross-account picture a multi-client agency needs.
Date-range picker on the reports, and export to PDF or CSV for client decks and board reports.
How It Works
As your team works (new contacts come in, deals move stages, conversations and calls happen, invoices get paid, campaigns send), the dashboard and report views update from that same underlying data. There is no nightly sync to a separate BI tool and no extra reporting seat to buy.
You pick a client sub-account, open the dashboard or a specific report view, set a date range, and read the numbers. Anything you want out of the system goes to PDF or CSV.
For paid-ads and website data, you connect the client's Google Ads and Google Analytics accounts once under Settings, Integrations. From then on the Paid Ads and Organic (GA4) views show that account's real data. When you need to step back, the agency-wide analytics view aggregates every client into one screen.
Because Seedly ships as source code you own, the reporting layer is not a locked black box. If a client wants a custom KPI or you want a board report the default dashboard does not have, you (or an AI coding assistant like Claude) can build it directly in the code.
You are running 10 to 100 clients and you need two things at once: a clean, per-client dashboard each client can trust, and a single agency-wide view so you know which accounts are thriving and which are slipping. Seedly gives you both, out of one install, with no per-seat reporting fee.
Rented CRMs and bolt-on BI tools charge per user or per dashboard. You own this, so it is unlimited seats, unlimited client dashboards, one-time cost. The same reporting runs across every sub-account, scoped per client, plus the rollup, and you can white-label it so each client sees their numbers under your brand.
Owning the code means you are never stuck waiting on a vendor's roadmap for the one chart a client keeps asking for. Add the view and ship it. And the reports do not lie: the paid-ads and GA4 views were rebuilt to show real connected-account data or an honest prompt, never placeholder numbers, so clean data in means reports you can actually put in front of a client.
You own the reporting suite. Run it everywhere, white-label it, rebuild any view you want.
The Rest Of The Garden
Every module ships in the same source code you own. Slide through the rest of the garden.
FAQ
Both. The Pipeline view covers opportunity value, win/loss, sales velocity, stage breakdown and a weighted revenue forecast, and it sits alongside invoice metrics (revenue, outstanding, overdue). You get the money picture, not just activity.
Yes. Every report is scoped to a single client sub-account by default, so each client only ever sees their own numbers. On top of that, an agency-wide analytics view rolls all of your clients into one screen.
It pulls live data. Connect a client's Google Ads and Google Analytics (GA4) accounts under Settings, Integrations, and the Paid Ads and Organic views show that account's real performance. If an account is not connected, you see a "connect this account" prompt rather than fake numbers. The older placeholder data in these two views was removed.
Over a dozen views: Overview, Acquisition, Lifecycle, Activity, Pipeline, Conversations, Calls, Campaigns, Workflows, Calendar, Agent Performance, Attribution, SEO (Google Business Profile plus Google Search Console), Paid Ads, and Organic (GA4), plus the main dashboard and the agency-wide rollup. There are also dedicated analytics screens inside Campaigns, SMS broadcasts, workflows, social, and QR codes.
Yes, and this is the point of owning the code. The default suite covers most agencies, but if a client wants a custom KPI or a board report the built-in views do not have, you (or an AI coding assistant like Claude) can build it directly in the code. There is no built-in no-code dashboard builder; the customization comes from owning the source. No vendor ticket, no upgrade tier.
Yes. Reports have a date-range picker and export to PDF or CSV, so you can drop them straight into a client deck or send the raw numbers to a spreadsheet.
Yes. Seedly is white-label per client, so each client sub-account's dashboard and reports appear under your agency's brand, not Seedly's.
You can migrate your contacts, opportunities, conversations and other core records, and the reports build from that data going forward. Historical paid-ads and GA4 numbers come from the connected Google accounts themselves, so that history follows the account, not the CRM.

One-time payment. No subscriptions. No renewals.
Secure checkout via Stripe. Your license key is emailed instantly.